NMAP: Syntax examples for some common Matlab commands
Nick Teanby 2016
Contents
Defining a vector
Defines a row vector of zeros of length 5
x = zeros(1,5)
x =

     0     0     0     0     0
Defines a column vector of zeros of length 5
x = zeros(5,1)
x =

     0
     0
     0
     0
     0
Defines an evenly spaced row vector from 0 to 2 spaced by 0.5
x = 0:0.5:2
x =

         0    0.5000    1.0000    1.5000    2.0000
transpose (swap rows and columns around) to turn into a column vector
x = x'
x =

         0
    0.5000
    1.0000
    1.5000
    2.0000
define elements by elemet
x = [1,3,6,10,2]
x =

     1     3     6    10     2
change and element
x(2) = 10000;
x
x =

           1       10000           6          10           2
Defining an array
arrays are defined row then column define a square 3x3 array of zeros
x = zeros(3)
x =

     0     0     0
     0     0     0
     0     0     0
define an array 3rows x 4columns array of zeros
x = zeros(3,4)
x =

     0     0     0     0
     0     0     0     0
     0     0     0     0
define elements by hand. Separate elements in different columns by commas, and by ; for next row
x = [1, 2, 3; 4, 5, 6]
x =

     1     2     3
     4     5     6
change an element in row 2 and column 3
x(2,3) = 100;
x
x =

     1     2     3
     4     5   100
Checking variable definitions
you can see what variables are defined using the 'whos' command
clear all
x=100;
y=zeros(3);
z=zeros(100,2);
whos
  Name        Size            Bytes  Class     Attributes

  x           1x1                 8  double
  y           3x3                72  double
  z         100x2              1600  double
or just check a single variable
whos z
  Name        Size            Bytes  Class     Attributes

  z         100x2              1600  double
For Loops
Example to sum the elements of a vector
x = [1,2,3,4,5];
n = length(x);
xsum = 0;
for j=1:n;
  xsum = xsum + x(j);
end
xsum
xsum =

    15
Example to multiply all elements by 100
x = [1,2,3,4,5];
n = length(x);
for j=1:n;
  x(j) = x(j)*100;
end
x
x =

   100   200   300   400   500
Example to multiply only first 2 elements by 100
x = [1,2,3,4,5];
for j=1:2;
  x(j) = x(j)*100;
end
x
x =

   100   200     3     4     5
Example to calculate difference between elements (note that the loop starts at index 2 and the xdiff vector of differences has one less element than the original x vector)
x = [10,20,40,100,300];
n = length(x);
xdiff = zeros(1,n-1);
for j=2:n;
  xdiff(j) = x(j)-x(j-1);
end
xdiff
xdiff =

     0    10    20    60   200
Nested for loops
These are often used for two dimensional array processing Example to sum all the elements of the array
x = [1,2,3,4;5,6,7,8;9,10,11,12];
[nrows,ncolumns] = size(x);
xsum = 0;
for j=1:nrows
  for k=1:ncolumns
    xsum = xsum + x(j,k);
  end
end
xsum
xsum =

    78
If statements and logic
These are used to handle different logical cases within a program. The constructs are:
& (AND), | (OR), == (equal to), ~= (not equal to), > (greater than), >= (greater than or equal to), etc
% Example to check if x is bigger than 3
x = 3;
if x >= 3
  disp('x is bigger than or equal to 3')
else
  disp('x is not bigger than 3')
end
x is bigger than or equal to 3
Example to see if x falls within a range
x = 3;
if (x >= 2) & (x <= 4)
  disp('x is in the range 2 to 4')
elseif x > 4
  disp('x is greater than 4')
elseif x < 2
  disp('x is less than 2')
else
  error('Something has gone wrong')
end
x is in the range 2 to 4
Example to see if x falls outside a range
x = -1;
if (x <= 2) | (x >= 4)
  disp('x is outside the range 2 to 4')
else
  disp('x is inside the range 2 to 4')
end
x is outside the range 2 to 4
Example to make a vector of random numbers and count how many are in the range 0.5-1
n = 7;
x = rand(n,1);
count = 0;
for i=1:n
  if (x(i) >= 0.5) & (x(i) < 1.0)
    count = count + 1;
  end
end
disp(['x = ' num2str(x')])
disp(['Number in range 0.5-1 is ' num2str(count)])
x = 0.81472     0.90579     0.12699     0.91338     0.63236     0.09754      0.2785
Number in range 0.5-1 is 4
User interaction and messages
print out a message to screen
%>> disp('Computer here, is anyone listening?')
getting user input (\n starts a new line for you to type into)
%>> x = input('Enter value of x\n')
print out an error message and stop program exectution
%>> error('Maximum number of data exceeded')
PLOTTING: line graphs
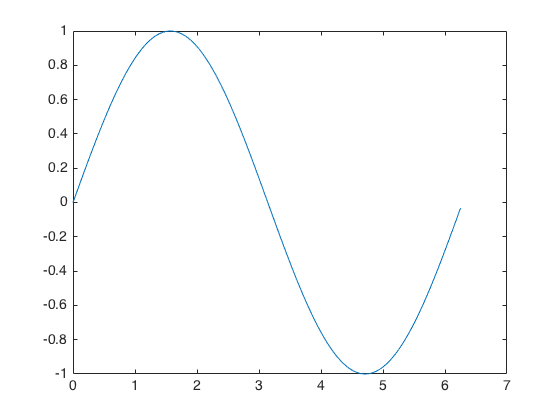
plot sin(x) between 0 and 2$\pi$ radians.
Important: all angle are in radians in Matlab
x = 0:0.05:2*pi;
y = sin(x);
plot(x,y)
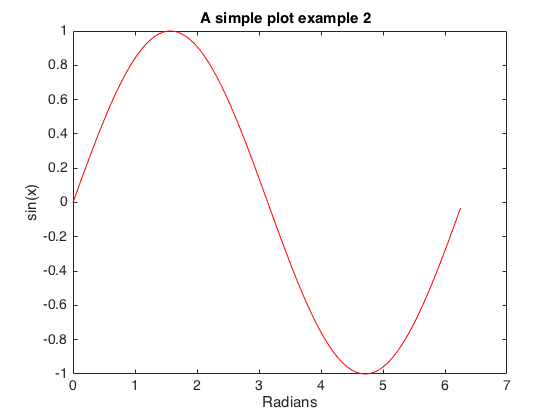
Add some titles and use a different line colour
x = 0:0.05:2*pi;
y = sin(x);
plot(x,y,'-r')
xlabel('Radians')
ylabel('sin(x)')
title('A simple plot example 2  ')
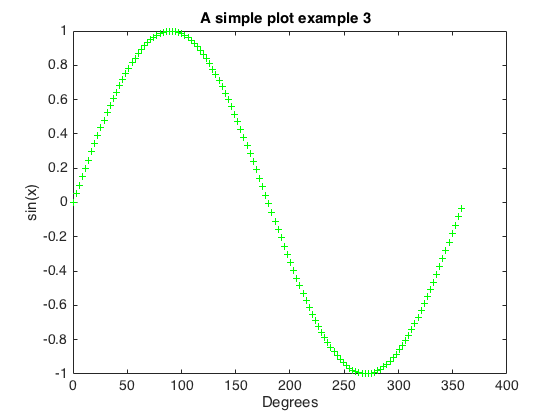
plot it in degrees
x = 0:0.05:2*pi;
y = sin(x);
xdegrees = x*180/pi;
plot(xdegrees,y,'+g')
xlabel('Degrees')
ylabel('sin(x)')
title('A simple plot example 3  ')
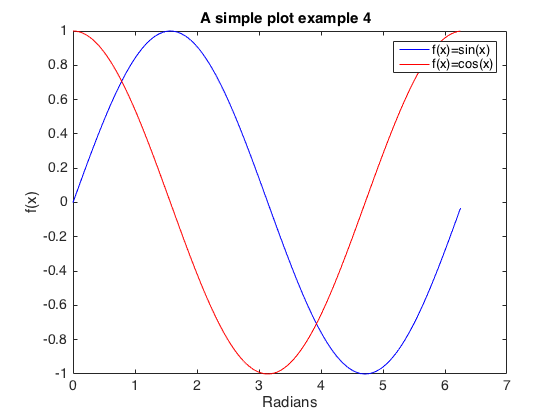
plot multiple lines on one graph. 'hold on' stops it being replotted
x = 0:0.05:2*pi;
y = sin(x);
z = cos(x);
plot(x,y,'-b')
hold on
plot(x,z,'-r')
hold off
xlabel('Radians')
ylabel('f(x)')
title('A simple plot example 4  ')
legend('f(x)=sin(x)','f(x)=cos(x)')