This example shows how to simulate the effect of a texture preserving phase transition (topotaxy) between MgSiO3 post-perovskite and MgSiO3 perovskite on increasing temperature or decreasing pressure in the lowermost mantle. Post-perovskite is assumed to deform by simple shear in its stability field and this is modelled using the VPSC code. The output of this modelling (a collection of Euler angles) is the input to this script. The Euler angles are first used to generate a model of the elasticity of textured post-perovskite just before the phase transition. A rotation matrix is built to describe the topotaxy and, together with the Euler angles, this is used to generate a model of the elasticity of the perovskite following the phase transition. Finally, a set of Euler angles representing the transformed perovskite is generated and these can be used to begin a further VPSC calculation of the deformation of pre-textured perovskite. This example is the program used to generate the results in Figure 2 of Dobson et al. (2013). Further information can be found in the supplementary information of that paper.
|
Note
|
MTEX and optional arguments
The example is packaged as a function taking a number of optional
arguments to give the source of the VPSC output and restart files
but these are not needed. The script can most simply be run as
These can be used to examine how different assumptions for the active slip systems in perovskite and post-perovskite alter the results. |
The code for this example can be found in /examples/topotaxy/topotaxy_model.m which,
after parsing the optional arguments described above, performs a number of operations
on the Euler angles read in from the input file.
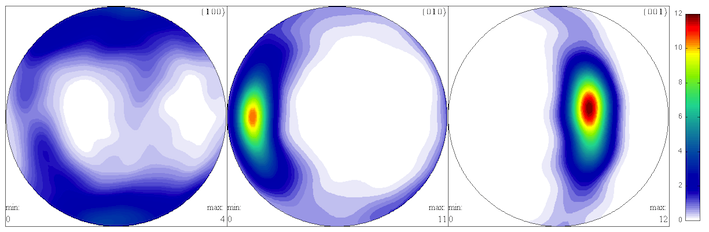
The input (post-perovskite) Euler angles are read into the
array eulers using the included function read_VPSC_file(), which
takes a file name as an argument. Pole figures of the input texture
are shown below. These are only produced if MTEX is installed (see
plot_pole_figure() for details.
The elasticity of the input polycrystalline aggregate can then be
calculated using MS_rotEuler() and MS_VRH().
% Elasticity of textured ppv pre-transformeation
Cs = zeros(6,6,nxtls);
for i = 1:nxtls
Cs(:,:,i) = MS_rotEuler(C_ppv, eulers(1,i), eulers(2,i), eulers(3,i));
end
rhos = ones(nxtls,1)*rh_ppv; % All crystals have the same density.
vfs = ones(nxtls,1); % Same volume fraction for each point
% - normalised by MS_VRH.
[C_ppv_av, rh_ppv_av] = MS_VRH(vfs, Cs, rhos);
report_elasticity(C_ppv_av, rh_ppv_av, ...
'post-perovskite before transformation');
if write_elastic
% Save Cij in format for reflectivity calc.
MS_save(ppv_elastic_name, C_ppv_av, rh_ppv_av, 'Aij', 'eunit', ...
'Pa');
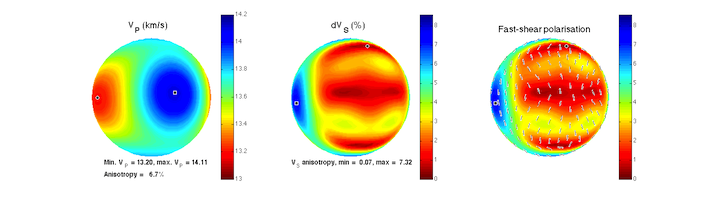
endThe function report_elasticity prints the resulting elasticity matrix
and draws the phase velocity pole figures shown below.
Experiments suggest that the perovskite to post-perovskite phase transition
exhibits topotaxy with the relations $[001]_{pv}=[001]_{ppv}$
and either $[100]_{pv}=[1\bar{1}0]_{ppv}$ or
$[100]_{pv}=[110]_{ppv}$. This relationship is expressed as
a rotation matrix by the function getTopotaxyRotations(), which
calculates unit vectors along the crystallographic axes and then
builds the rotation matrix to go from one to the other.
For ease of manipulation the Euler angle triples describing the
texture are also converted
into rotation matrices using the rot_from_Euler() function:
function [ g ] = rot_from_Euler(phi1, theta, phi2)
    % Given three Euler angles phi1, Phi, phi2 (Bunge notation,
    % in degrees) return a rotation matrix, g, representing the
    % rotation. This is the 'passive' rotation.

    % Pre-compute trig functions.
    cp1 = cos(phi1*pi/180.0);
    sp1 = sin(phi1*pi/180.0);
    cp2 = cos(phi2*pi/180.0);
    sp2 = sin(phi2*pi/180.0);
    cth = cos(theta*pi/180.0);
    sth = sin(theta*pi/180.0);

    % Form rotation matrix for Bunge convention of
    % Euler angles, see eq 24 (pg81) of "Preferred
    % orientation in deformed meals and rocks... H-K Wenk (ed)"
    g = [cp1*cp2 - sp1*sp2*cth, sp1*cp2 + cp1*sp2*cth, sp2*sth ; ...
        -1*cp1*sp2 - sp1*cp2*cth, -1*sp1*sp2 + cp1*cp2*cth, cp2*sth; ...
        sp1*sth, -1*cp1*sth, cth];
end
This allows the Euler angles of the aggregate after the phase transition to be calculated:
% Texture of transformed material
% ===============================
transformed_eulers = zeros(size(eulers));
% Only do this if we need to for output or plotting
for x = 1:nxtls
if (chooser(x) < 0.5)
g = rot_from_Euler(eulers(1,x), eulers(2,x), eulers(3,x));
g = g*transA';
[phi1, Phi, phi2] = rot_to_Euler(g);
else
g = rot_from_Euler(eulers(1,x), eulers(2,x), eulers(3,x));
g = g*transB';
[phi1, Phi, phi2] = rot_to_Euler(g);
end
transformed_eulers(1,x) = phi1;
transformed_eulers(2,x) = Phi;
transformed_eulers(3,x) = phi2;
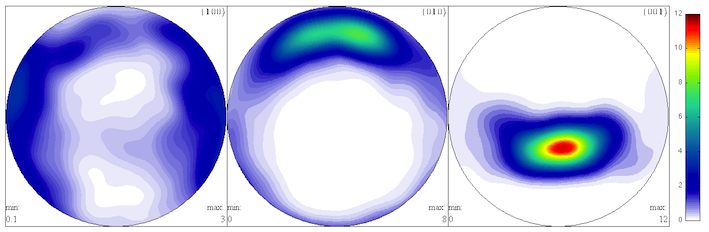
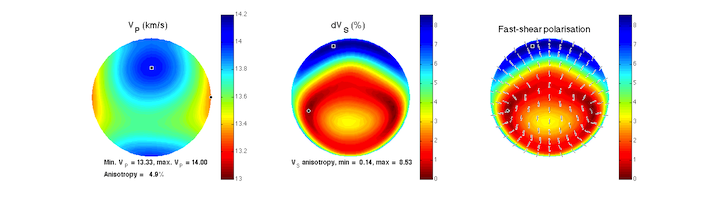
endalong with its elasticity. Pole figures for the transformed texture and phase velocity are shown below.
The resulting texture and elasticity is then optionally written out for further use. The
file /examples/topotaxy/extract_pv_def_results.m is a cut down version of the example
described above which focuses on only the analysis of elasticity allowing the output
perovskite texture to be further deformed using the VPSC code and the results examined.
References
-
D. P. Dobson, N. Miyajima, F. Nestola, M. Alvaro, N. Casati, C. Liebske, I. G. Wood and A. M. Walker (2013) "Strong texture inheritance between perovskite and post-perovskite in the D$^{\prime\prime}$ layer". Nature Geoscience. 10.1038/NGEO1844
-
F. Bachmann, R. Hielscher and H. Schaeben (2010) "Texture analysis with MTEX — free and open source software toolbox". Solid State Phenomena 160:63-68. 10.4028/www.scientific.net/SSP.160.63