Mid-mantle anisotropy
This page outlines a study of seismic anisotropy in the mid-mantle around the Tonga-Kermadec subduction system, using modelling and data analysis of shear-wave splitting, done as a part of my PhD research.
Introduction
-
Until recently, the mid-mantle region of the Earth (the transition zone and the uppermost-lower mantle)
has been considered isotropic. We present evidence of anisotropy in the mid-mantle region near
the Tonga-Kermadec subduction zone, inferred from shear wave splitting in
teleseismic S-phases at Australian seismic stations.
 |
Map showing locations of events (red circles), stations (blue triangles) and iasp91 (Kennett and Engdahl, 1991) predicted raypaths in the lower mantle. Also shown is plate motion in the hotspot reference frame (grey arrows) and plate boundaries (Gripp and Gordon, 1990), topography/bathymetry from (Smith and Sandwell, 1997) and depth of seismicity of the Tonga, Kermadec and New Hebrides subduction zones (Gudmundsson and Sambridge, 1998). |
Data Analysis
-
We apply the eigenvalue method of Silver and Chan (1988), to teleseismic
S-phases at Australian seismic stations from deep Tonga-Kermadec
events.
 |
Example of Silver and Chan (1988) dt/phi grid search to measure shear-wave splitting. |
Modelling
-
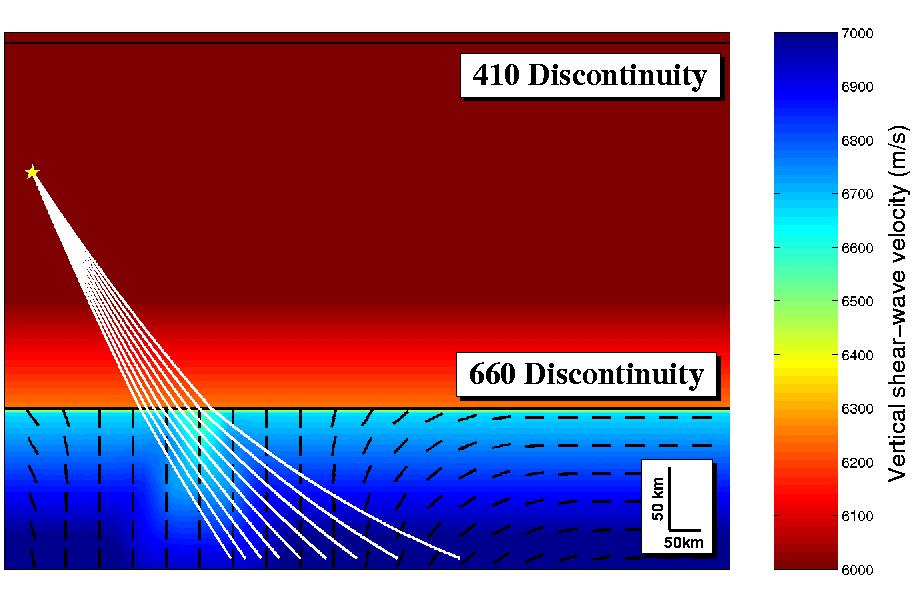
We use anisotropic raytracing (ATRAK) to predict shear-wave splitting for different models of
mantle anisotropy. These can be used to interpret real data results.

|
Example model of mid-mantle anisotropy due to an upwelling in the uppermost lower-mantle beneath the descending Tonga slab (Gurniss et al, 2000). The colour scale denotes the (vertical) shear wave velocity and the black vectors the symmetry axis of the imposed transverse isotropic media. The white lines are example raypaths. |
Results
-
Results show splitting times which are very difficult to reconcile
with a model placing anisotropy only in the upper-mantle below the station.
Modelling suggests that the results can be explained by anisotropy in the
mid-mantle region. The most effective location for this anisotropy is just
below the 660km discontinuity.

|
Shear wave splitting analysis of an event at station NWAO, Australia. The analysis window is shown by the vertical dashed lines. This analysis shows a well constrained splitting result with rather convincing correction of transverse energy (panel D) and particle motion (panel C). The best-fitting shear wave splitting parameters were determined to be dt=6.3+/-0.35s and phi=-46+/-4deg. The seismograms were filtered using a bandpass filter with corner frequencies of 0.02 and 0.15Hz. |

|
Shear wave splitting time versus epicentral distance for real data and various models of mid-mantle anisotropy. |
Conclusions
-
We propose several possible scenarios for anisotropy below the 660km discontinuity.

Possible scenarios of mid-mantle anisotropy. Three postulate the lattice-preferred orientation (LPO) of mid-mantle minerals, in a global boundary layer (Panel A), by stress-fields associated with subduction (Panel B, after, e.g., Nippress et al, 2003) or by an upwelling in the lower mantle (Panel C, after Gurnis et al, 2000). The final scenario is the shape-preferred orientation (SPO) of subducted material (for example, basaltic melt) (Panel D), in a 'megalith' in the uppermost lower-mantle (after, e.g., Ringwood, 1994).
Publications and recent conference abstracts
-
James Wookey and J-Michael Kendall
Evidence of mid-mantle anisotropy from shear-wave splitting and the influence of shear-coupled P-waves
JGR 109 B07309 (2004) (PDF) -
James Wookey
Modelling and Interpreting Seismograms for 3D Earth Structure: A Study of Mid-Mantle Anisotropy
PhD thesis, School of Earth Sciences, University of Leeds, 2003. (Abstract) -
James Wookey, J-Michael Kendall and G. Barruol
Reply to comment on: Mid-mantle deformation inferred from seismic anisotropy.
Nature 422 136 (2003) (PDF) -
James Wookey, J-Michael Kendall and G. Barruol
Mid-mantle deformation inferred from seismic anisotropy.
Nature 415 777-780 (2002) (PDF) -
James Wookey and J-Michael Kendall
Evidence of mid-mantle anisotropy from shear-wave splitting and the influence of shear-coupled P-waves
ESF Research Conference: The Deep Earth, Theory, Experiment and Observation. Acquafredda di Maratea, Italy. September 2003 -
James Wookey and J-Michael Kendall
Mid-mantle anisotropy from shear-wave splitting
EGS-AGU-EUG Joint Assembly, Nice, May 2003